# Dashboard editor
The dashboard editor gives the user the ability to setup a dashboard with the drag and drop editor and the available widgets. He can assing datapoints and deives to it and make it a template for all of the same devices.
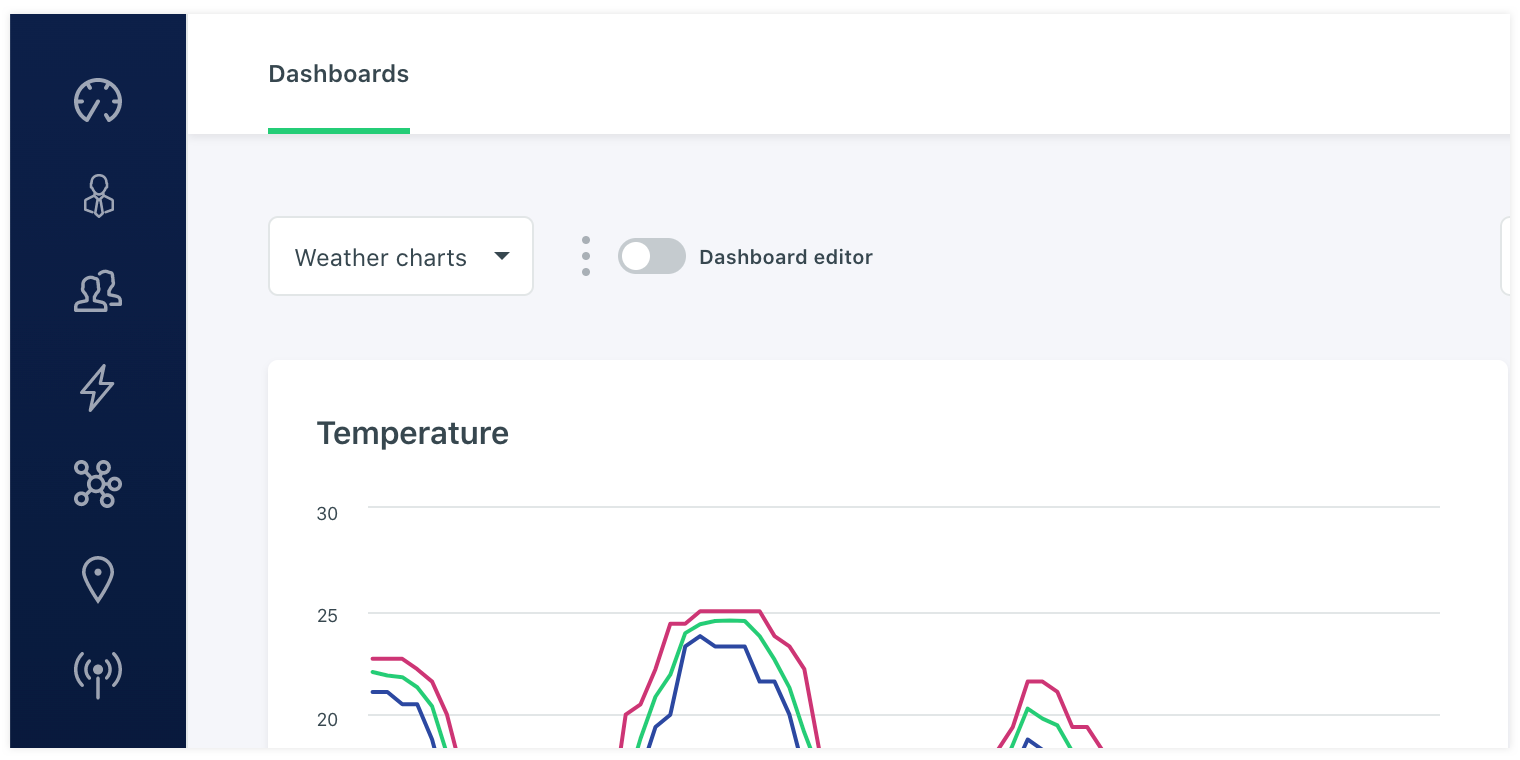
# Dashboards
The dashboard page is the collection of all dashboard templates that are made. These can be assigned to devices by selecting them, or by selecting a label. In that case all devices with that label use the dashboard. if there is no data present the widget will stay empty or if the user doenst have permissions to look at the datapoint, the widget wont be rendered.
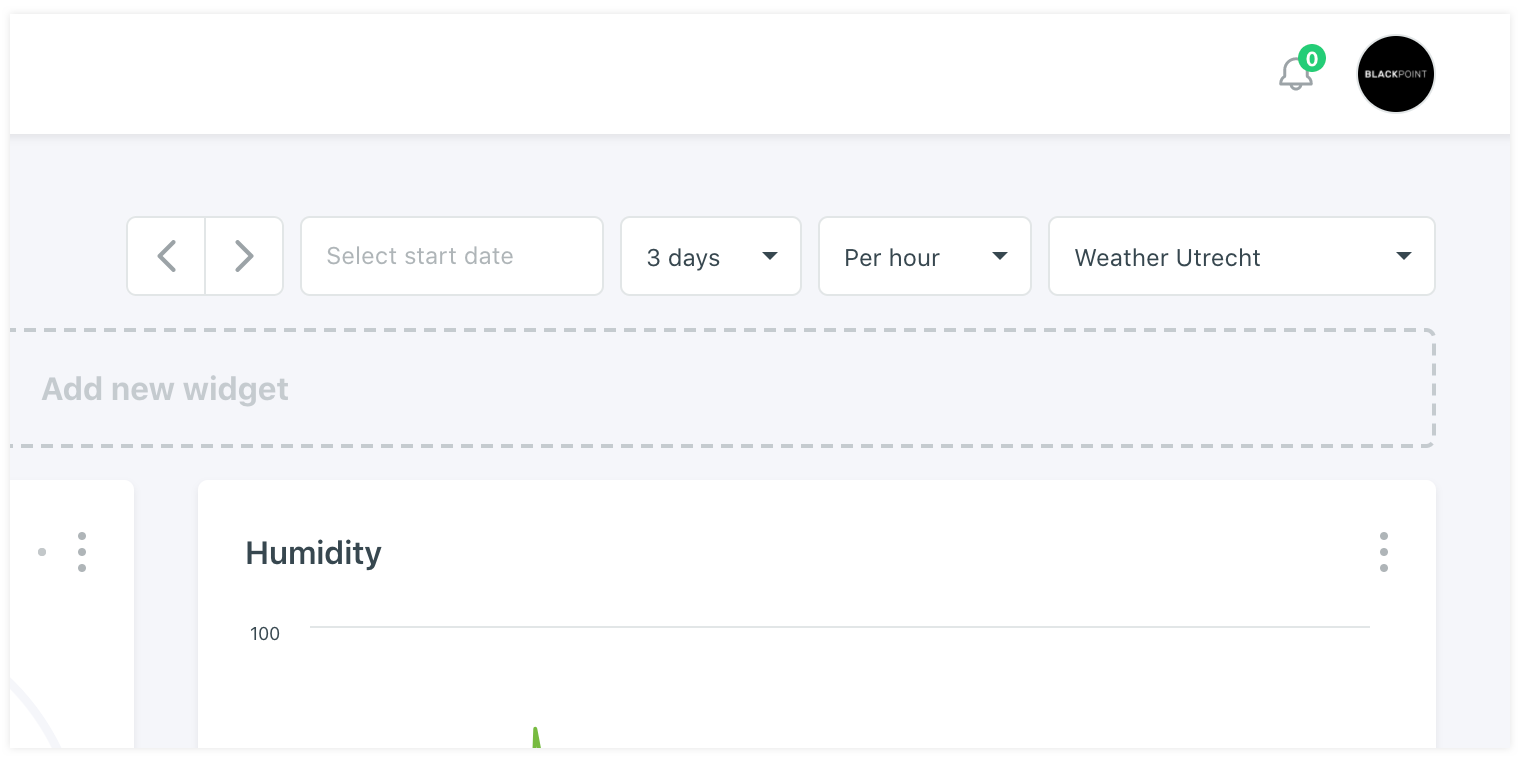
# Dashboard control
To control the dashboad you can use the controllers in the top right. You can switch between the time aggregation, the frequency and the devices that have this template assigned to.
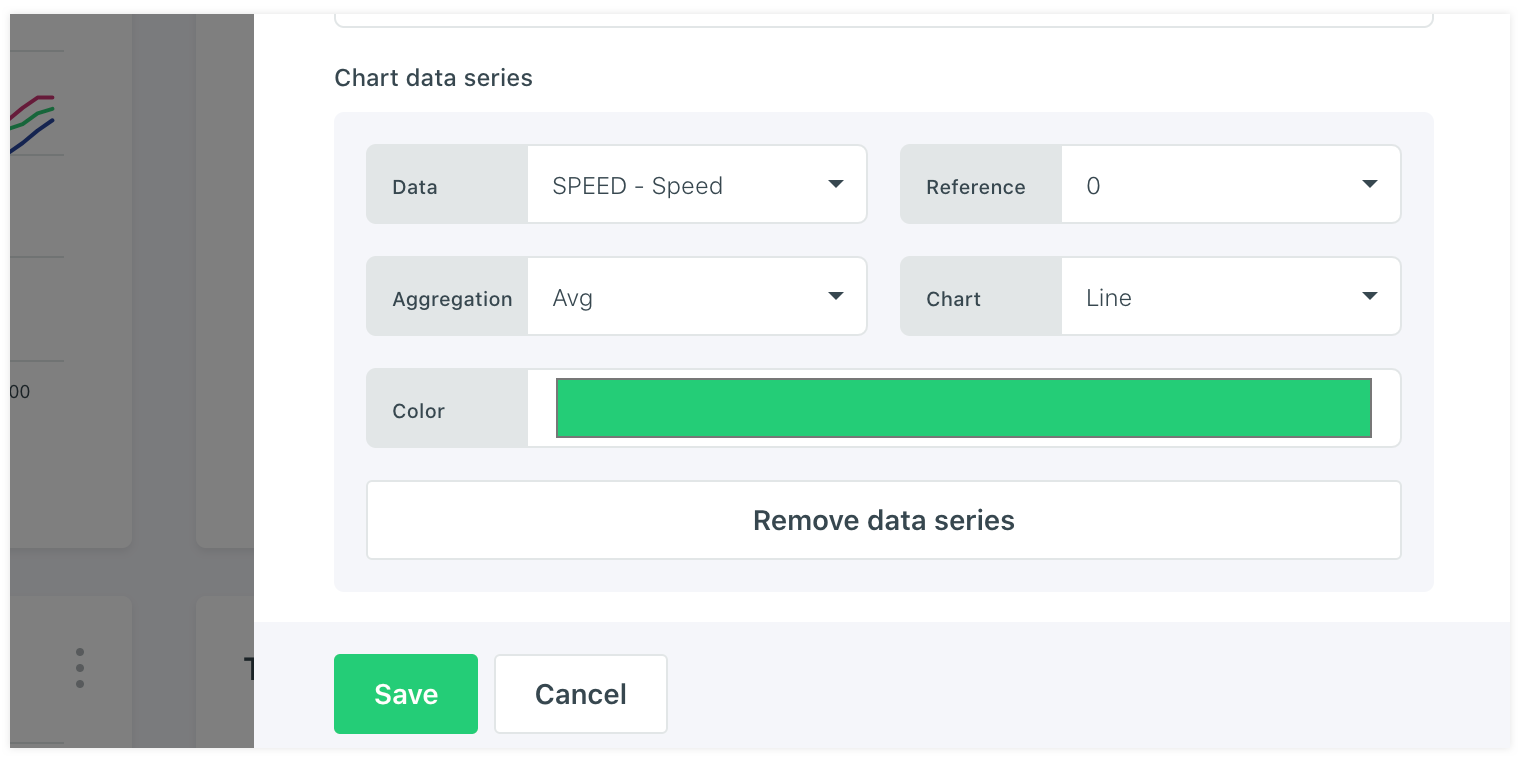
# Chart widgets
When adding a chart widget you will need to select the data source for it. You can define multiple datapoints all with a different type of chart view. You can give it a color and a type of aggregation aswell. Like min, max, avg, sum, count and total.
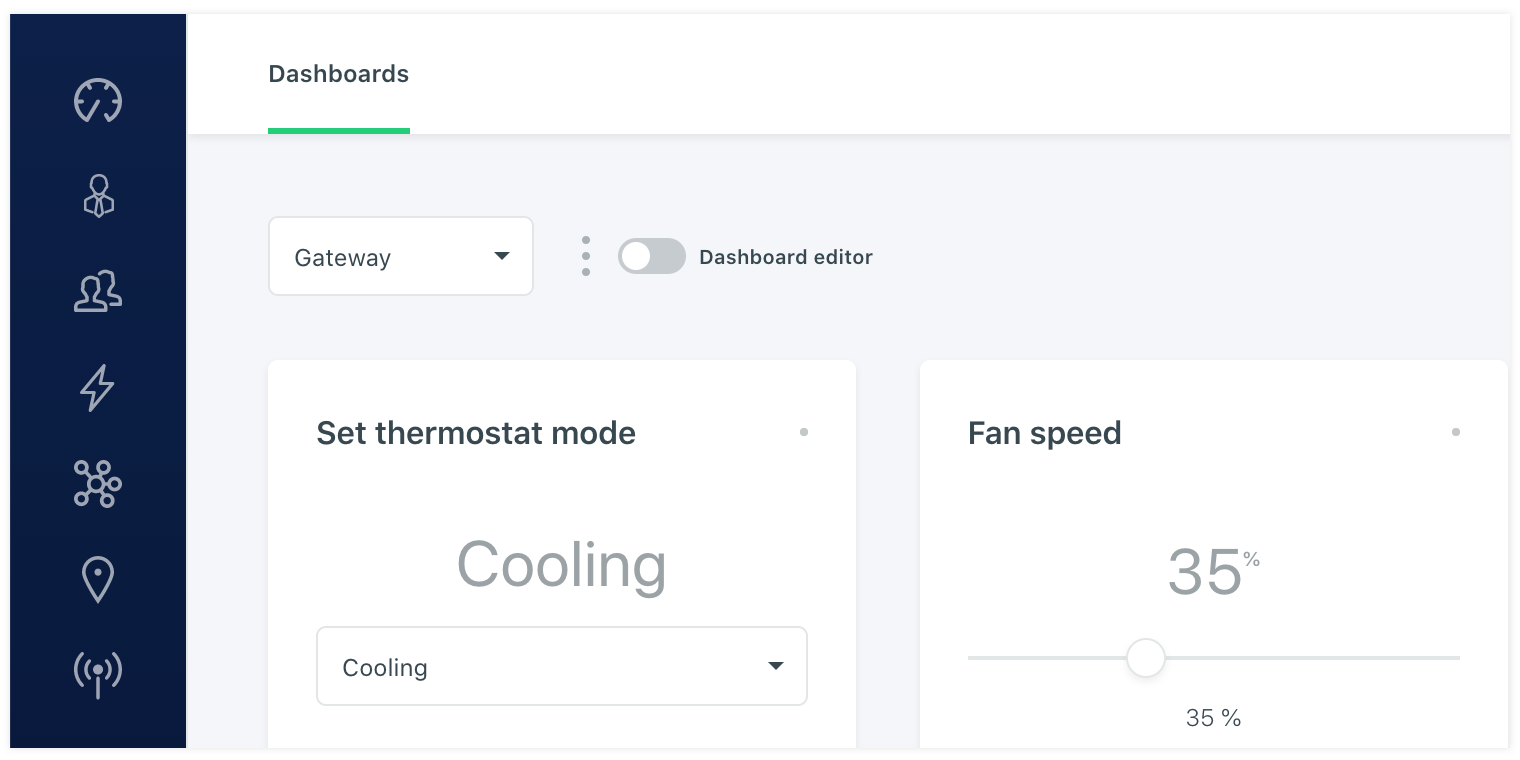
# Callback widgets
It is also possible to add callback widgets. This widget gives you the ability to send data back to the device. This can be for example a reboot command. To do this you will have to add a button widget or a dropdown widget. In the form you choose the right data point that is callback enabled on the datapoint page. When you select the right datapoint you are able to setup what value is send when the button action is pressed. In case of a dropdown widget you can only select a flag datapoint. In this datapoint the actions are all ready defined in the datapoint edit form and used in the widget.